
We get to speak to digital marketing agencies a lot. Normally they’re looking for any one of a number of solutions: budget monitoring, marketing performance alerts, reporting solutions – but invariably they all have some version of the master sheet or dashboard. If you’ve worked at a digital marketing agency then you almost certainly know this sheet. Various APIs dump into hidden ‘raw data’ worksheets, an unbelievable number of nested formulas & vlookups, and some sort of color code formatting. The usefulness of its purpose is undeniable (why else would basically every agency build one?) but generally speaking, they are a nightmare to maintain. The reality is that the sheet/dashboard format calls the cost:value ratio into question. We advocate freeing yourself of the risk and freeing your team of the workload; here’s why:
Cost of labor
These sheets seem like they should be straight forward, right? Once you’ve transferred raw data in and built a structure, it should just work. Well, I’m here to tell you that it never does. I’ve never encountered one of these sheets that isn’t constantly falling over or breaking. It endlessly requires investigation and fixing and all that work ends up on the lap of someone. Even if you set aside a client hourly rate and just went on the cost of labor, how much is that total over the course of a month? Even a good month might still require a few hours a week. Very quickly that cost is totalling something that eclipses the cost of a tool that does it for you.
Cost of risk
Some of the spreadsheet performance dashboards I’ve seen have been true masterpieces. The level of depth and organization of the data that is pulled in through a myriad of complex formulas is truly impressive. Conversely, some I’ve seen are quite a bit more manual. Regardless of the level of complexity, at some point it stands on pretty consistent human input – and that means a sizable risk that data points are recorded incorrectly or that formulas end up getting screwed up. Either way, an incorrectly reported budget or performance metrics could have big ramifications. Clients don’t tend to be that forgiving if you’ve ended up massively over/under spending based on avoidable errors.
Dependency
If you’re a large agency with a whole Market Sciences department – a whole host of people who know their way around the inner workings of spreadsheets then you can skip this one. For the rest of us, the responsibility of building and maintaining these spreadsheets and dashboards typically falls on one person – either for reasons of ability or bandwidth. This creates a real point of dependency – if this spreadsheet performance dashboard ends up being a crucial part of your agency’s process and the sole person responsible for it leaves, well, that’s a real problem.
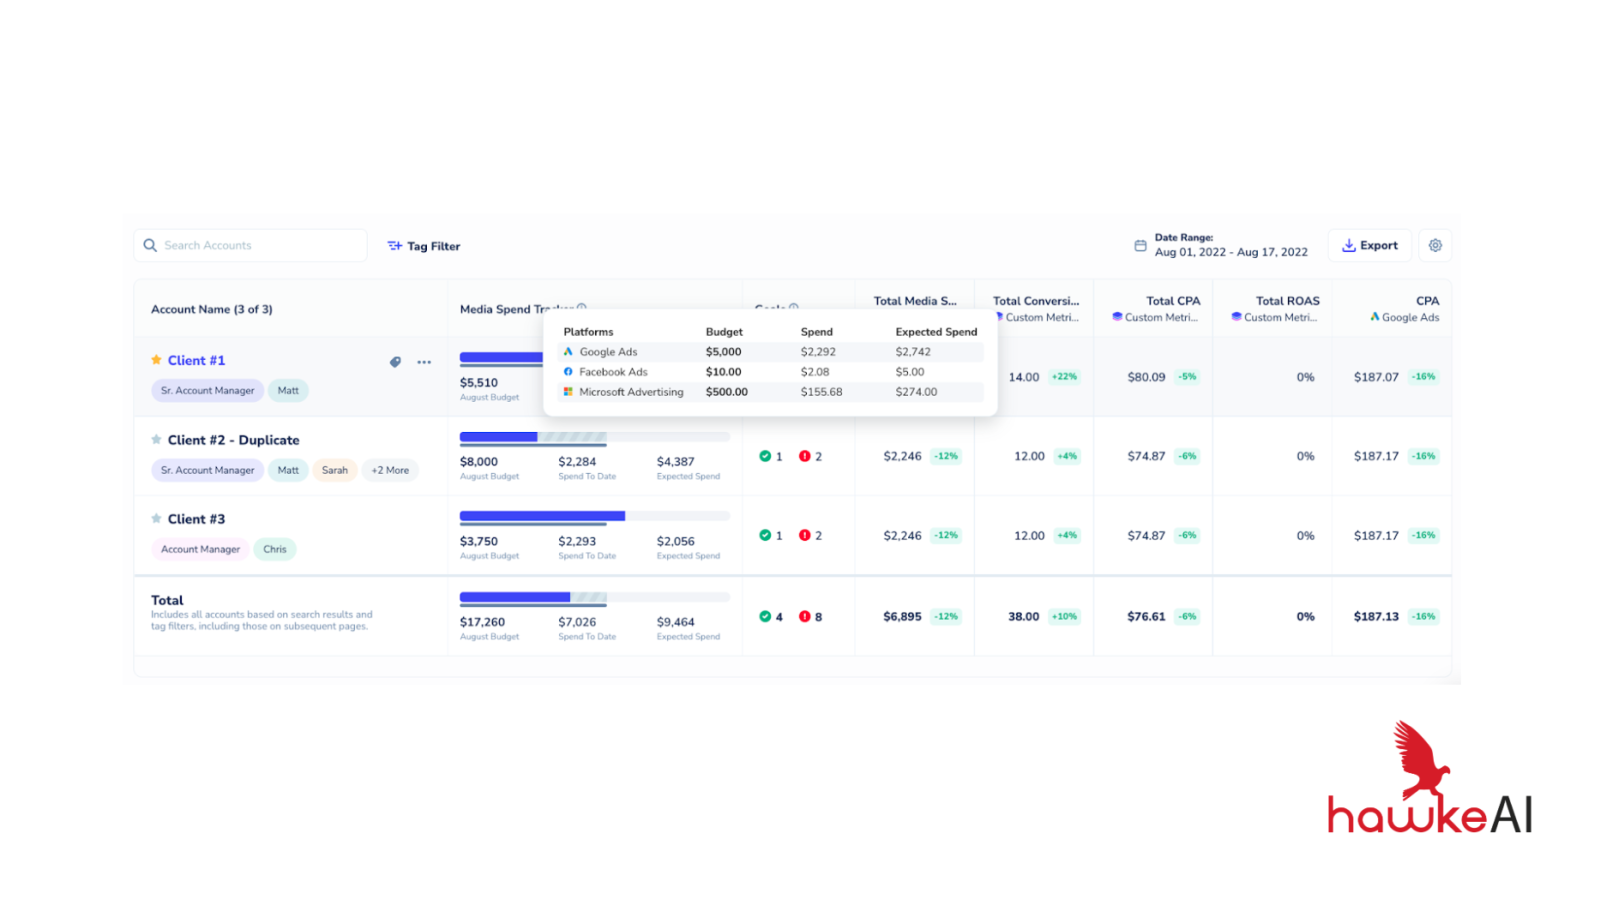
As many of you will know, Hawke AI originated from within a digital marketing agency. And it was exactly this issue that it was trying to solve. From the get-go the intention was to build something stable, reliable, and accessible so that the place where all performance and budget data was amalgamated – the place where we could actually look to see if we were doing what we’re paid to do – was something that we could depend on. That platform has been refined over the years to add in additional elements, like alerts, that further its usefulness – but never straying from the key goal: that it is a marketing performance dashboard that can be depended on. Perhaps it’s time to give up on the spreadsheets.